
Rent Collection Statistics (2026): Late Rent and Payment Methods
September 2, 2026
Every landlord knows the feeling of watching the first of the month arrive. But how often do renters actually fall behind? How do landlords collect, and how do tenants want to pay? And who is doing the collecting? The answers exist. They’re just scattered across Census surveys, IRS tables, and Federal Reserve reports.
This page pulls them into one place, with a strict rule: official sources only. Every figure below comes from the Census Bureau, HUD, the Federal Reserve, the IRS, the BEA, the BLS, or the GAO, linked where it first appears, with full details in the sources and methodology section at the end. No vendor surveys, no marketing data. You are welcome to cite any statistic here with attribution and a link.
Key rent collection statistics
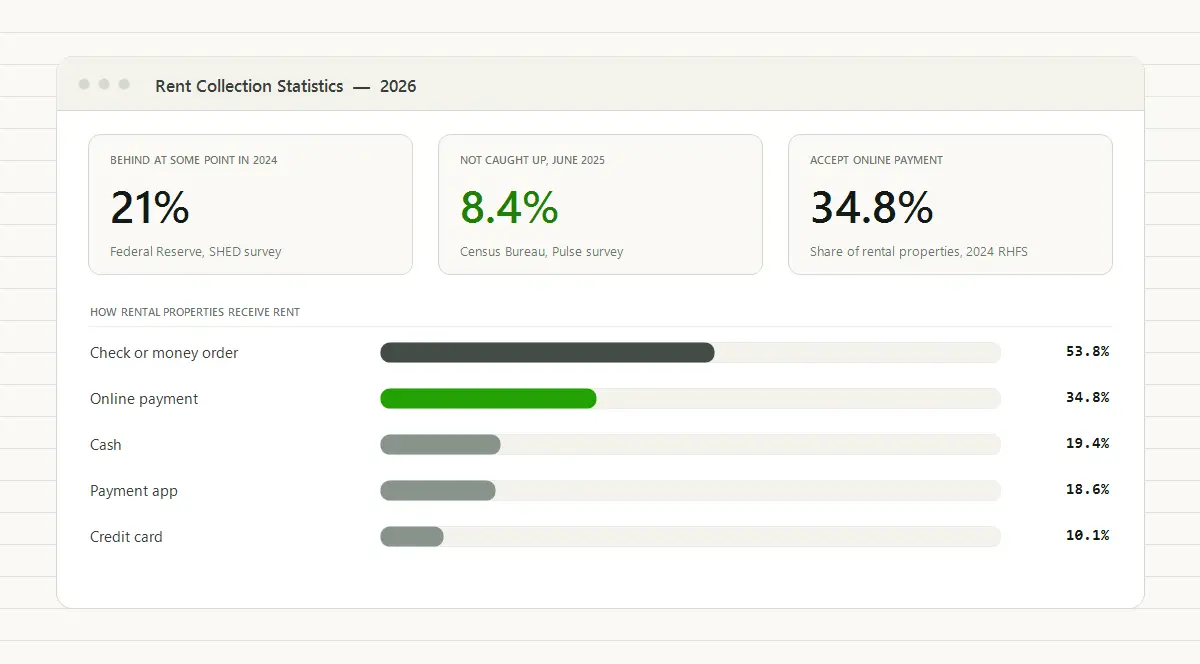
- 21% of renters were behind on rent at some point during 2024 (Federal Reserve)
- 8.4% of adults in renter households were not caught up on rent in June 2025; the predecessor survey measured roughly 1 in 5 at the pandemic peak in early 2021 (U.S. Census Bureau)
- 53.8% of U.S. rental properties reporting a payment method take rent by check or money order; only 34.8% accept online payment (TenantLedger analysis of the 2024 Rental Housing Finance Survey)
- Measured by rental units instead of properties, online-payment acceptance rises to about 54%: the gap is a small-landlord gap (same analysis)
- Individual investors own 59.6% of single-unit rental properties, down from 70.9% in 2021 (Census/HUD RHFS)
- About 9.3 million individual tax returns, 5.7% of all filed, reported rental real-estate income or loss in tax year 2022, and nearly half reported a net loss (IRS Statistics of Income)
- U.S. tenants paid about $777 billion in rent in 2025, up from $537 billion in 2020 (Bureau of Economic Analysis)
- The national rental vacancy rate was 7.3% in the second quarter of 2026, and the median asking rent for vacant units was $1,531 (U.S. Census Bureau)
Data reviewed August 2026.
How many renters fall behind on rent?
Here’s something worth knowing before you compare your portfolio to anyone’s numbers: no official statistic measures on-time rent payment month to month. What the government does measure, carefully and repeatedly, is who falls behind. Two official surveys answer that from different angles.
The Federal Reserve’s Survey of Household Economics and Decisionmaking asks renters about the whole year: 21% said they had been behind on their rent at some point during 2024. The burden is heavily tilted by income, with nearly one in four renters earning under $100,000 reporting falling behind, against 6% of renters earning more.
The Census Bureau’s Household Pulse surveys ask about a single moment: in June 2025, 8.4% of adults living in renter households said their household was not caught up on rent. The survey’s differently designed predecessor measured 19.4%, roughly one in five, at the pandemic peak in January 2021, so treat the two as separate snapshots rather than points on one line.
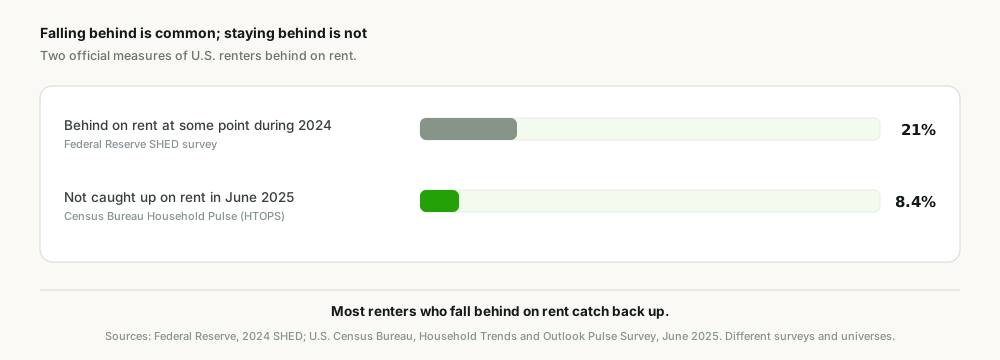
Put the two measures side by side and the most useful fact in rent collection emerges: falling behind is common, but staying behind is not. Over a year, about one renter in five slips at least once. At any given moment, fewer than one in ten adults in renter households is behind. Most renters who fall behind catch back up, which is why late and lost are very different outcomes for a landlord.
When falling behind turns into moving out
Evictions are the expensive tail of that distribution, and the official data here is thinner than you’d expect. The Federal Reserve found that 2% of renters moved in 2024 because of an eviction or the threat of one, which works out to 14% of the renters who moved that year. Beyond that, the Government Accountability Office has said it plainly: there is little comprehensive national data on evictions, and no federal statistic counts filings.
What happens when rent is late
For the tenant, a late payment usually means a grace period, then a late fee, both set by the lease. About a third of states add statutory limits on top: caps typically between 4% and 12% of monthly rent or a flat amount, sometimes with a required grace period before any fee can be charged. In the rest, the lease controls and the fee still has to be reasonable. Our late fee calculator includes a state-by-state table of grace periods and caps.
For the landlord, the stakes are bigger than the fee. IRS data shows how thin rental margins actually are. For tax year 2022, about 4.9 million returns reported net rental income totaling $97.3 billion, while 4.3 million reported a net rental loss totaling $94.7 billion (IRS Statistics of Income, Table 1.4). Nearly half of the filers with rental real estate activity lost money on it that year. When the line between profit and loss is that thin, a single tenant who stays behind can be the whole margin.
That’s also why the record matters as much as the money. A late payment becomes a dispute when nobody can say exactly what was owed, when it was due, and what arrived. A dated rent ledger turns “rent is late” into a number you can act on, and a clean rent payment history is what settles the conversation months later.
How landlords collect rent
The 2024 Rental Housing Finance Survey asked landlords, for the first time, how they receive rent. The Census Bureau hasn’t published a summary of the new question yet, so we tabulated the public use file ourselves. Weighted across the 16.6 million U.S. rental properties that answered the question (of roughly 19 million total), with owners free to select more than one method:
| Payment method | Share of rental properties accepting it |
|---|---|
| Check, cashier’s check, or money order | 53.8% |
| Online payment | 34.8% |
| Cash | 19.4% |
| Payment app | 18.6% |
| Credit card | 10.1% |
Another 10.7% named some other method, and 1.3% use a third-party payment service.
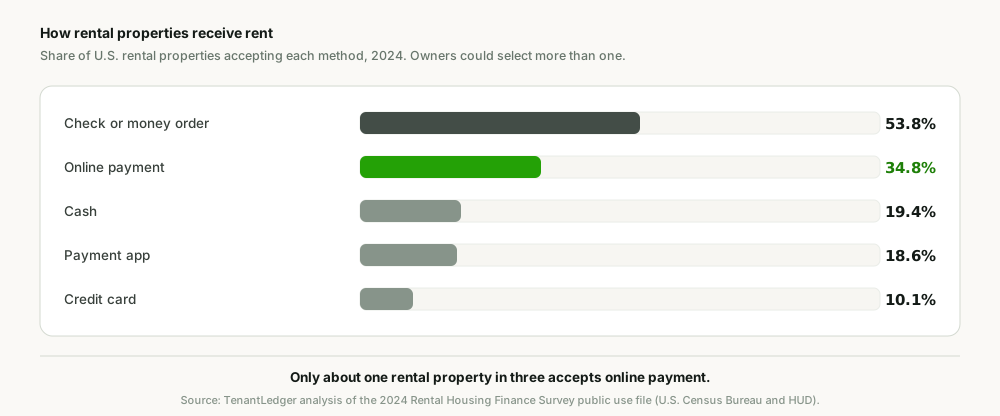
Read that second row again: only about one rental property in three accepts online payment. Then weight the same data by rental units instead of properties, and online acceptance jumps to about 54% while checks climb to 68%. Big buildings offer online payment as a matter of course. The gap is concentrated exactly where most of America’s rental properties are: with small landlords.
Closing that gap doesn’t require an enterprise platform. TenantLedger gives every tenant a portal where they can see exactly what they owe and pay it online, and each payment posts straight to the tenant’s ledger. Here’s how the tenant portal works, and how to start collecting rent online if you’re setting it up for the first time. Still tracking payments in a spreadsheet? There’s a better way to do that too. And if you’re already a TenantLedger customer, rent collection best practices covers putting these numbers to work.
Who owns America’s rental housing
There are roughly 19 million rental properties in the United States containing about 49.7 million rental units (2024 RHFS). The stock is dominated by small properties: 82.9% of rental properties contain just one unit, and nearly half of all rental units sit in properties of one to four units.
Who owns them is changing.
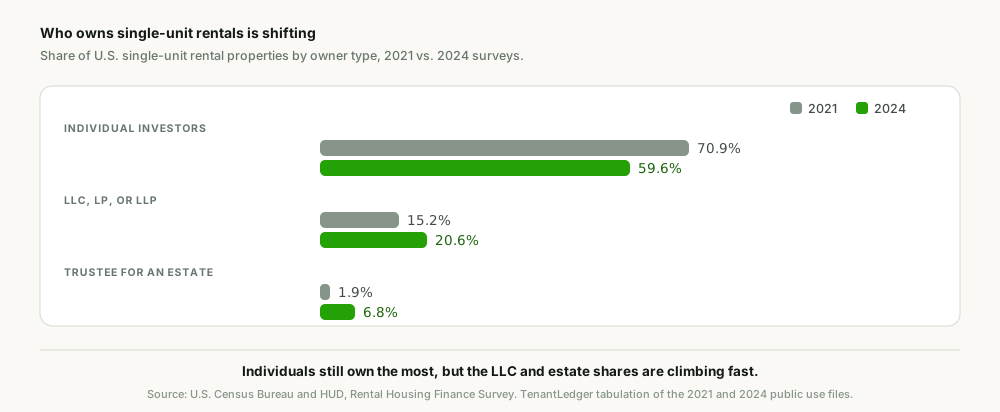
Between the 2021 and 2024 surveys, the share of single-unit rental properties owned directly by individual investors fell from 70.9% to 59.6%. That ownership didn’t move to Wall Street. REITs and real estate corporations combined own just 1.8% of single-unit rentals. It shifted instead to LLC, LP, and LLP structures (15.2% to 20.6%) and to trustees for estates (1.9% to 6.8%). Much of the change looks like the same small landlords wrapping properties in an LLC, plus a growing wave of inherited rentals.
Zoom out from single-unit properties and the picture holds: across all rental properties, individual investors own 58.9% (TenantLedger analysis of the 2024 RHFS). The IRS sees the same landscape from the tax side. About 9.3 million individual returns, 5.7% of all returns filed, reported rental real-estate income or loss in tax year 2022. Companies own the big buildings. People own everything else.
The rental market behind the numbers
A few figures that put the collection statistics in context:
- 46.8 million renter households occupied 31.3% of the U.S. housing inventory in the second quarter of 2026 (Census Housing Vacancies and Homeownership).
- The national rental vacancy rate was 7.3%, ranging from 9.5% in the South down to 5.3% in the West (same release).
- The median asking rent for vacant units was $1,531. Sitting tenants pay less than newly listed units ask: renters surveyed by the Federal Reserve reported a median rent of $1,200 in 2024.
- Renter households spent an average of $15,893 on their rented homes in 2024, about 27.8% of everything they spent that year (BLS Consumer Expenditure Survey).
And the total at stake keeps growing. U.S. tenants paid about $740 billion in rent in 2024 and roughly $777 billion in 2025, up about 45% from $537 billion in 2020 (Bureau of Economic Analysis).
Sources and methodology
Every statistic on this page comes from an official government source, accessed August 2026, and no figure is estimated or interpolated. The one exception is the state late-fee summary, which comes from our own review of state statutes, published as the state table on the late fee calculator page. You are welcome to cite this page or reuse the charts with attribution and a link.
- U.S. Census Bureau / HUD, 2024 Rental Housing Finance Survey (released February 19, 2026). Property counts, ownership shares, and payment methods. Percentages labeled “TenantLedger analysis” are our own weighted tabulations of the 2024 public use file (4,425 property records). Payment-method bases exclude properties with no reported answer; ownership shares are computed across all single-unit properties, including those with no reported owner type, and excluding nonresponse instead yields modestly higher shares for every owner type with the same trend. Unit-weighted figures use each property’s reported unit count. Where Census publishes a comparable figure, our tabulation reproduces it. 2021 comparisons use the 2021 RHFS public use file.
- Federal Reserve, Survey of Household Economics and Decisionmaking (SHED), 2024 (published May 2025). Renters behind on rent during the year, income breakdown, median reported rent, and eviction-related moves.
- U.S. Census Bureau, Household Pulse Survey and Household Trends and Outlook Pulse Survey. Share of adults in renter-occupied units whose household is not caught up on rent: 8.4% computed from the June 16–25, 2025 HTOPS table (6,990,466 of 82,921,384), 19.4% from the January 6–18, 2021 table. Census labels these data experimental, publishes counts rather than shares, and redesigned the survey in 2025, so the 2021 and 2025 figures come from differing methodologies and are presented as separate snapshots rather than a trend line.
- U.S. Census Bureau, Housing Vacancies and Homeownership, Q2 2026 release (July 28, 2026). Vacancy rates, renter household counts, and median asking rent.
- IRS Statistics of Income, Individual Income Tax Returns, Publication 1304, Table 1.4, tax year 2022. Rental net income and net loss return counts; the 9.3 million figure is the sum of returns with rent net income (4,925,212) and rent net loss (4,345,158) against 161.3 million total returns.
- Bureau of Economic Analysis, personal consumption expenditures on rental of tenant-occupied housing (via FRED). Total annual U.S. tenant rent spending.
- Bureau of Labor Statistics, Consumer Expenditure Survey, 2024 (2024 data). Average renter-household spending on rented dwellings, which includes rent plus related dwelling costs.
- U.S. Government Accountability Office, GAO-24-106637 (February 2024). The state of national eviction data.
One caution about a number you may see elsewhere: the claim that U.S. landlords collected “$428 billion in rent” circulates widely, but it reflects only rent reported on individual tax returns. The whole-market figures from the Census Bureau and BEA above are substantially higher.
The bottom line
The numbers say rent collection mostly works: fewer than one in ten adults in renter households is behind on rent at a given moment, and most who fall behind catch back up. They also say the margin is thin, since nearly half of rental filers reported a loss in the latest IRS data, and that most small-property landlords still don’t offer the online payment options large buildings treat as standard. If you want the portal, the ledger, and the record without the enterprise price tag, TenantLedger’s 14-day free trial takes an evening to set up: start here, no credit card required.
Common questions
What percentage of tenants pay rent on time?
No official statistic measures on-time rent payment month to month. The closest official measures track who falls behind: the Federal Reserve found 21% of renters were behind on rent at some point during 2024, and Census Bureau data from June 2025 shows 8.4% of adults in renter households not caught up on rent at that moment. Read together, most renters pay on time in a given month, and most who fall behind catch back up.
What percentage of tenants pay rent late?
The Federal Reserve's 2024 survey of household economics found 21% of renters had been behind on rent at some point during the year, with the rate near one in four for renters earning under $100,000 and 6% for those earning more. At any single moment the share behind is much smaller: 8.4% of adults in renter households were not caught up on rent in June 2025, per the Census Bureau.
How much of the rent owed is eventually collected?
No official national statistic measures rent collected versus rent owed. The official data does show that most arrears are temporary: the share behind at a given moment (8.4% of adults in renter households in mid-2025, per the Census Bureau) is far below the share who fall behind at some point in a year (21% of renters, per the Federal Reserve), which means most renters who slip catch back up.
Who owns most rental properties in the United States?
Individuals do. The 2024 Rental Housing Finance Survey shows individual investors own 59.6% of single-unit rental properties, with LLC, LP, or LLP structures at 20.6% and rising. REITs and real estate corporations combined own just 1.8% of single-unit rentals. Large institutions dominate big apartment buildings, but the typical American rental property is owned by a person.
What percentage of Americans are landlords?
About 9.3 million individual tax returns, or 5.7% of all returns filed, reported rental real-estate income or loss in tax year 2022, according to IRS Statistics of Income data. The IRS counts returns rather than people, but it is the best official measure of how many Americans are landlords.
What is a typical late fee for rent?
There is no single national number, because late fees are set by the lease, and only about a third of states impose statutory limits. Where limits exist, caps typically run from 4% to 12% of monthly rent or a flat amount, and some states also require a grace period before any fee can be charged. In the remaining states the lease controls, and the fee still has to be reasonable. TenantLedger's free late fee calculator includes a state-by-state table of grace periods and caps.
Property management software with real accounting built in
Track your properties, leases, charges, and payments in one place.
14-day free trial · No credit card required